Sunday, February 28, 2021

Free Linear Graph Template with Error Bars, Max and Min, and Feedback for IB Physics

Yet again, I've remade the IB Physics Graphing Template. This latest version is the best one yet:

IB Physics Graphing Template


Try it out. It's totally free and runs in your browser: http://beepboopmachines.com/

Features:

  • Graphs linear data with error bars and automatically generates a best fit, a steepest (max) fit, and a shallowest (min) fit.
  • You can reshape the trendlines by clicking and dragging them if you happen to not like the auto-generated trendlines.
  • Produces feedback about your data and graph. This will help you check to make sure you didn't miss anything important (like a graph title), and can also help you identify important talking points for a conclusion or evaluation.
  • Runs in your browser for compatibility with Windows, Mac, Linux, and even mobile or tablet!
  • You can share your graph as a URL if you want other people to work with your example. Great for teachers making examples, scaffolding, or tutorials.
  • Data table automatically grows to handle large amounts of data
  • You can enter data in a variety of forms: decimal (eg 0.00045), scientific (eg 4.5x10^-4), percentages (eg, 15%), and bizarro calculator format (eg, 4.5E-4)
  • The overall size, gridlines, titles, labels, units, and symbols in the graph can be edited by clicking anywhere on the title, legend, or axis labels. 

You can edit the properties of the graph by clicking anywhere on the title, legend, or axis labels


Let me know in the comments what you think. Some known issues:

  • I haven't tested the application in every browser and OS. 
  • Sometimes produces some pretty extreme max and min slopes. I haven't developed a good algorithm to handle every case. Drag the lines around if it comes up with lines you're not happy with
  • The performance of the program will drop as you add more and more data. 

Tuesday, March 6, 2018

Use Existing SQLite Database in Android using SQLDroid JDBC Driver

In Android the recommended SQLite database access method is to create a new database using the SQLiteOpenHelper class. However I wanted to be able to load a pre-existing SQLite database into an Android application and access it with a JDBC driver.

The reason is that I want my students to be able to play around with making a database with an application like SQLite Browser and then build on their work in their applications. I also wanted all of my students using similar database access methods so they can help each other as much as possible so I wanted them using JDBC. I've found that it is possible but first a few warnings:

  1. This method is inappropriate for large databases as it duplicates the whole database doubling the memory footprint
  2. This method also pulls in an external JDBC library, SQLDroid, further increasing footprint size
  3. The SQLDroid library is not guaranteed to be complete or correct across all android devices
But if you still want to load your existing SQLite database into your Android project and access it with a JDBC driver, here's how you can do it. I've started a fresh, empty project to try to keep it as simple as possible:

Move your existing SQLite database into your projects 'assets' folder

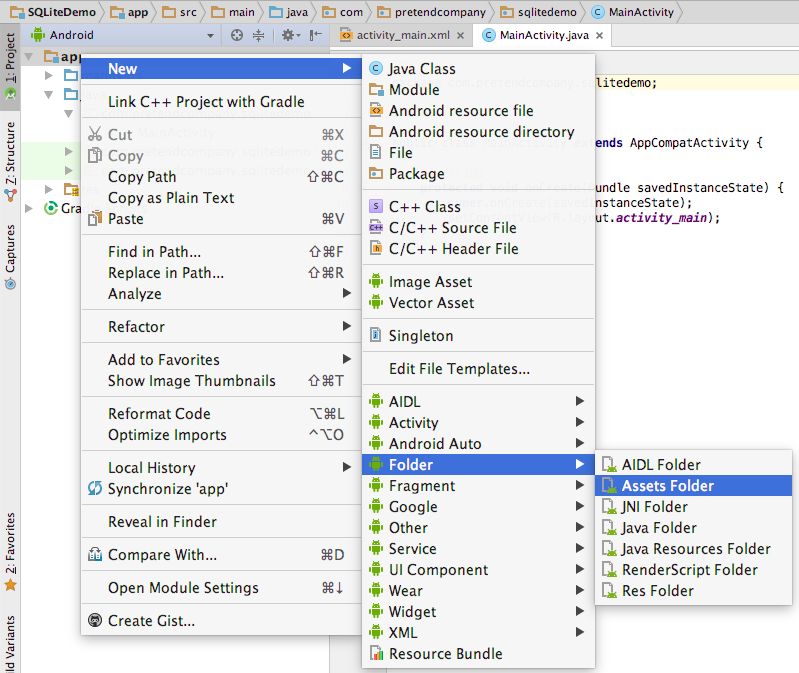
First you may need to create your assets folder if you don't see it in your project already

- right click on your project, select New > Folder > Assets Folder


- add the 'assets' folder to your main project:


- Navigate to your assets folder in your file browser (finder or windows explorer etc). I found it in /app/src/main/assets


 - drag and drop your database into this folder and it should appear in android studio. My database is a database of birds.


(Now is a good time to run your program and make sure it still runs without run-time errors!)

Add code to your project to copy your database into internal memory on the phone

The assets folder is a read-only directory that gets packaged up into your .apk to load on the phone. But we want to continue to add and remove from the database so when the app is run for the first time only, we will copy the database into internal memory.

- In your main activity, create a method called LoadDatabase and call it in the onCreate method. You'll also need a string called 'dbName' and four imports shown below for later


- In LoadDatabase,  check to see if there is already a database in Internal Storage. If not, copy it over from Assets


(Now is a good time to run your program and make sure it still runs without run-time errors!)

If you're running your phone at API level 23 or less, you should be able to use Android Device Monitor to see your new database file in Internal Storage after your program runs! 
 - Android/tools/Android/Android Device Monitor
 - select the file 'explorer' tab
 - navigate to data/data//files


Add the SQLDroid JDBC Driver to your project

Open your Gradle file (Module: app) and add this line:


- Save and Sync your Gradle file


(Now is a good time to run your program and make sure it still runs without run-time errors!)

Access your database in Internal Storage using your JDBC driver

- back in the main activity, I've added another method called 'TestDatabase' and called it from the onCreate Method


- We'll need a few more imported classes:


- Then we can load the SQLDroid JDBC driver and use it to make a connection to our database in Internal Storage.


In this case I'm using the JDBC driver to read all the 'BirdSpecies' records from my table 'BirdList' but you can use other SQL methods to read and write whatever is appropriate for your database


Run your program

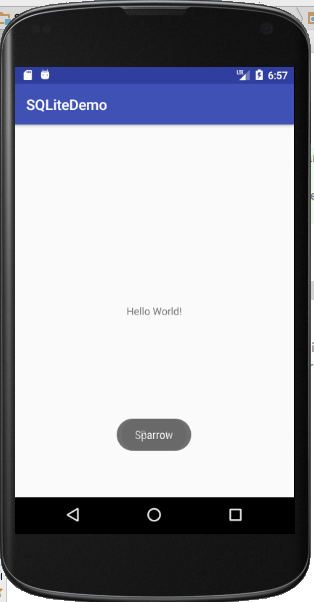
Run your program and hopefully your data will appear as a toast as soon as the program loads. Here you see sparrow appear as a 'Toast'. 'Parrot' follows next


Many thanks to the SQLDroid team for the driver and Juan-Manuel FluxĂ  for demo code on loading databases from Assets to Internal Storage

Hope that helps!

Tuesday, April 11, 2017

O'Neill Tennis 1.02 - Tennis on a Rotating Space Station

Back in 2014, I made a simulation that modeled throwing a ball in an O'Neill Cylinder and challenged anyone to make a 3D tennis game set on the same rotating space station. Three years later I've answered my own challenge and along the way learned about cross-platform development in Unity. The end result is this:

ONeill Tennis 1.02


You can download for Windows, Mac, or Linux .

The game itself is only moderately fun but I really enjoy just watching the ball move through the air. It's so hypnotically different to motion on earth.

If you want to play around with the project further you are welcome to build off my source code (available here) for any purpose. Changing player speeds, rotation rates, and ball speeds should be as simple as changing a parameter in GameBehavior.cs.

Wednesday, March 1, 2017

Science EE Wisdom Generator

At the end of the EE journey, I always ask students for advice they would like to pass down to future students. I've complied all their advice together and built this Wisdom Generator for Science EEs.


If you would rather not wait, you can click on the wisdom tab and read through the whole list one-by-one.

Monday, May 23, 2016

IB Physics Example Videos

It's taken about 2 years but I've finally finished a set of IB Physics Example Videos! (131 of them to be exact!)


The whole process started years before that when I found myself frustrated by how much content there was to discuss/apply/investigate in IB Physics and how little time there was to get it all done. My solution is to take most of the examples that I would normally do in class and record them as example videos for the students to watch before they attempt their homework.

I find that this frees up anywhere from 10-30 minutes per lesson! We have so much time available now that I've restructured my whole lesson plan:


  • First 10-25 minutes - Unstructured time for students to address their individual needs:
    • Get help from peers or teacher on homework questions or unclear topics
    • Read Ahead
    • Investigate Extension
    • Meet to discuss performance, study skills, etc
  • Remainder of the lesson - Lecture, Prac, Investigation, Groupwork, etc on new content
  • After the lesson - students watch example videos and attempt homework. They flag the questions they get stuck on and return to the next lesson to get help


Some topics have more examples than others, but every required HL and SL topic (and the HL/SL Astrophysics Option) has some examples. If you think something major is missing let me know but I don't think I'm going to be returning to this video set for a while. I'm on to my next challenge: starting up an IB Computer Science class!

If you are an IB Physics student or teacher feel free to use these example videos as you see fit.

Thursday, May 19, 2016

IB Physics Extension

One of the things I like to do in my class is allow students some time at the beginning of the lesson to help each other with their homework questions. The challenge, though, is making sure that students who are on top of things and aren't busy helping others can still be productive during that time.

To that end, I've compiled a collection of IB Physics Extension pages. The idea is that for whatever part of the syllabus your students are currently working on, there's some kind of related, self-guided extension that they could explore. It might be:

  • An interesting article on related science
  • A really tough problem
  • A thought-provoking video or application
  • A neat simulation


Just this week I've finally complied enough pages that there should be at least one page for any lesson in the IB Physics course, so no matter what lesson you're on you could always refer a student to the collection of extension topics.

You'll find all the pages here: https://onedrive.live.com/redir?page=view&resid=87532983CCE41649!742&authkey=!AO1VuIbAaVJkrkc

I find that I get the best uptake on this extension if I spend a minute of class time introducing a page or two before students break out into their work.

The collection is still growing so let me know if you spot something neat you think I should add!

Wednesday, February 10, 2016

Free Linear Graphing Template for the 2016+ IB Physics Syllabus

 Update: new, free, version released. See post here.

 
Download the Free Version of the IB Physics Graphing Template for 2016+ Here!

Enter your Data and Uncertanties and Let Excel Draw your Graph!
IB Physics Students Graduating in 2016 and later face a larger and more sophisticated Internal Assessment (IA). When it comes to making Linearised Graphs, the biggest difference is that students should now consider all their data when drawing best-fit, max, and min trendlines. 
Fortunately, I've updated the IB Physics Graphing Template to help do just that! Now when it calculates the max and min trendlines, it will search through every possible combination of corners of your data and select only the most extreme slopes that pass through all your error bars:

The Max and Min Trendlines consider all data points.

That's not the only update. Based on my experience with my own students, I've added a slider to adjust the number of significant figures reported in the trendline equations:

You can adjust the number of Significant Figures in the trendline equations.
The last big update is that the template now offers you feedback on your graph and data, to help you spot mistakes, make your analysis, and draw conclusions! For example, the last data point in this graph appears to be preventing any straight line from fitting through all the error bars:


The last data point appears to be preventing any straight line from fitting through all the error bars
To help students catch these issues, the template offers feedback:
The above error is automatically generated to let you know that something has gone wrong with your graph

Anyone can download and share the free version of the template which offers all the above features forever for as many graphs as you like. If you are a Physics teacher, you may be interested in purchasing a school-wide license for the full version which offers two extra features:

Additional Full (Paid) Version Features:

  • Demonstrate Animated Graphs (like the video at the top of this post)
  • Receive further feedback beyond error messages. How much frustration will you save if your students were automatically reminded of key bits of information like:

Example of Additional Feedback available in the Full (Paid) Version


Example of Additional Feedback available in the Full (Paid) Version
The full version comes with a school-wide license that doesn't expire, or require account management. Just share the file with your students like you would any other file. You can purchase the full version from the store in the upper right hand side of this page.

FAQ


Operating System Compatibility:

No matter what your operating system is, your going to need Microsoft Excel installed. The template will not work with other spreadsheet software like Numbers, Open Office, or Libre Office.
The template works very well in Windows, and acceptably well in Mac OS although I would suggest you download the free version to test functionality on your system before buying a full version license. Linux is untested at this time.

Macros:
 Because this template has a lot of new, sophisticated functionality, it wasn't possible to build it without Macros. Macros are extra bits of software written by the spreadsheet author (me, in this case) to add functionality to the spreadsheet. You must enable macros to run this software. If in doubt, talk to the IT department at your school.

Support:

 I'm not able to offer a guarantee of support but I will do my best to help you out if you have problems. Just post a message in the comments below and I'll get back to you. I'd recommend you check out the free version before buying the full (paid) version to make sure it meets your needs.

It's Running So Slowly!

In my experience the process of drawing the graph takes quite a while if: your on a Mac, you have a lot of data, or you are animating the graph. To keep things running smoothly, consider un-checking the "automatically generate graph" box. Once you've finished entering your data and uncertainties, then click the "generate graph" button. This way, nothing happens in the background until you're ready.